▶Quick start — your first map in 10 minutes
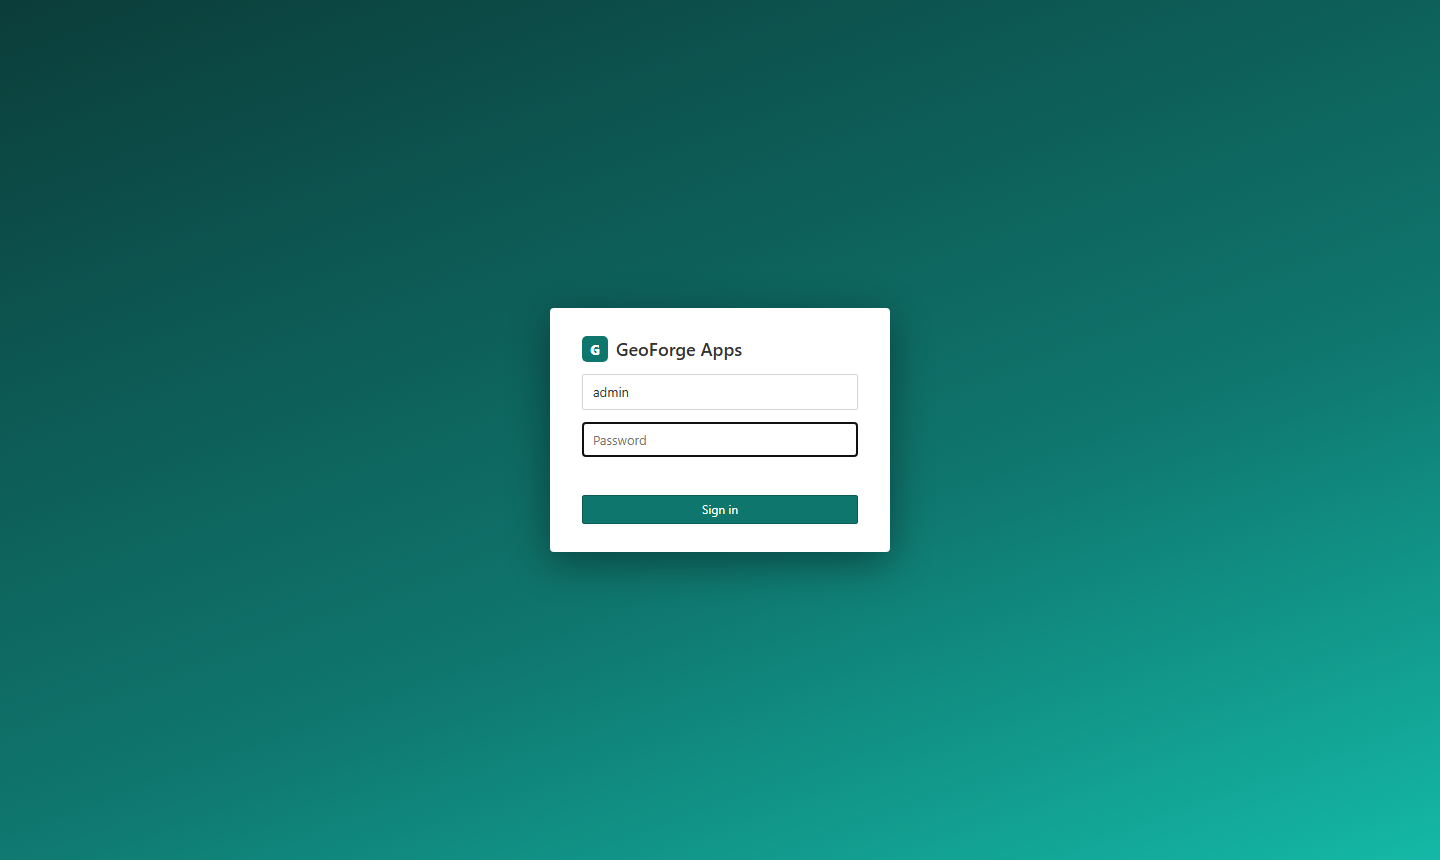
- Open geotee.gtdigital.tech and sign in with the username and password your administrator gave you.
- On the Map tab click Add Data, drop a zipped shapefile (or a GeoJSON / KML / CSV with coordinates) and press upload. The layer appears in the Catalog on the right.
- Double-click the layer in the Catalog. It draws on the map and appears in Contents on the left.
- With the layer selected, open Feature Layer › Appearance › Symbology and pick Graduated Colors or Unique Values.
- Press Ctrl+S to save the map with a name.
- Insert › New App from Map creates an app with a header, legend, layer list, filter and table already wired to your data.
- Design › Share → choose Anyone with the link → copy the link. Done.
1Signing in and finding your way around
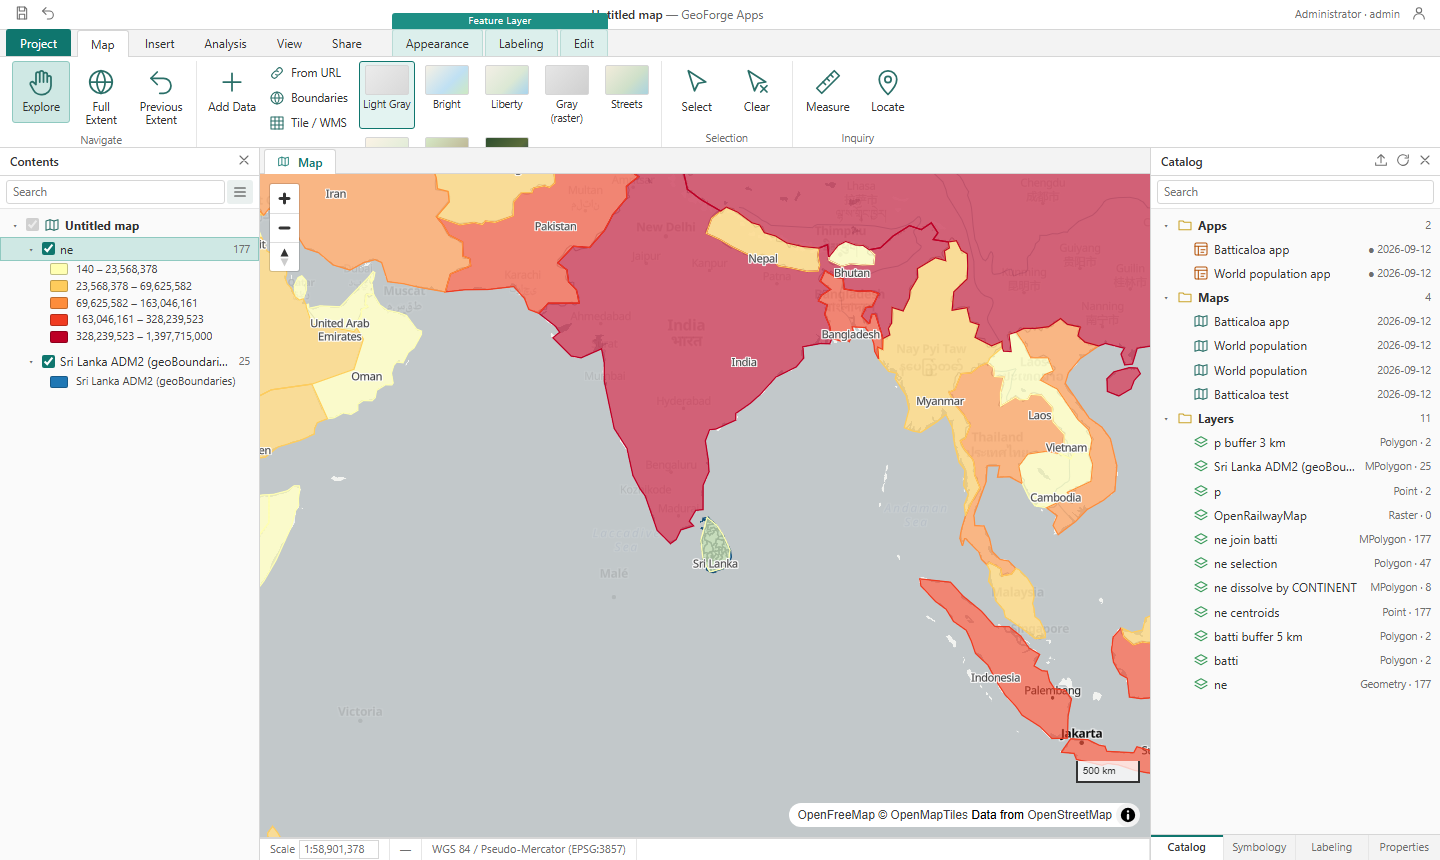
The workspace
| Area | What it is for |
|---|---|
| Ribbon (Project · Map · Insert · Analysis · View · Share) | Every command lives here, grouped by task. Coloured contextual tabs appear only when they apply: Feature Layer (teal) when a layer is selected, App Builder (amber) when you are designing an app. |
| Contents pane | The layers in the current map, top to bottom in drawing order. Tick boxes turn layers on/off. The legend classes show under each layer. Right-click a layer for a menu. |
| Catalog pane | Your library: Apps, saved Maps, and uploaded Layers. Double-click to open or add. The tabs at the bottom switch this pane to Symbology, Labeling or Properties. |
| Status bar | Map scale (you can type a scale, e.g. 1:50000), cursor coordinates, coordinate system, selection count. |
1:100000 into the scale box and press Enter.2Adding data
Everything you add goes into the layer library first, so it can be reused in any map or app. Map › Add Data opens a dialog with four tabs.
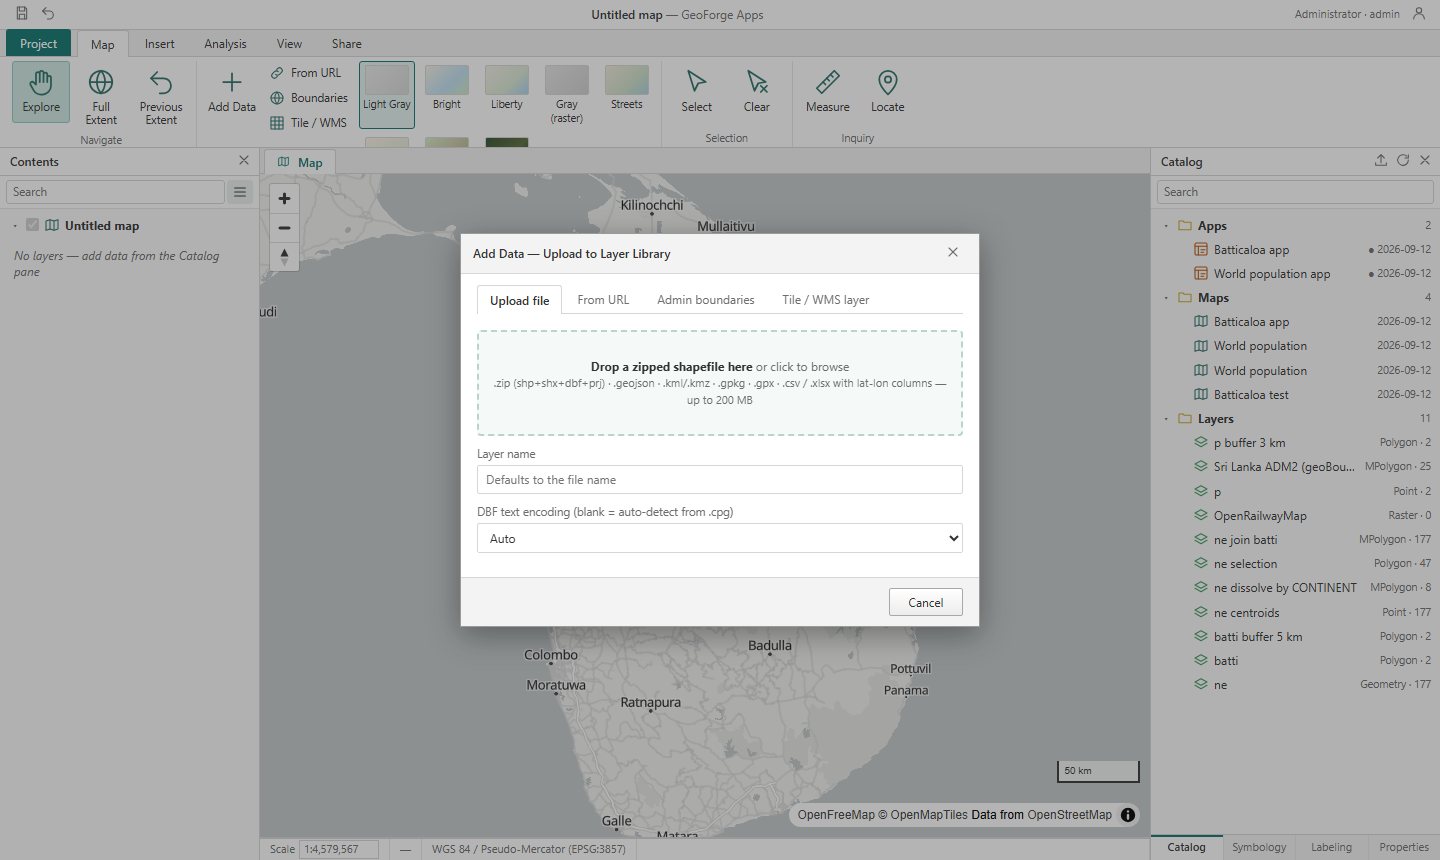
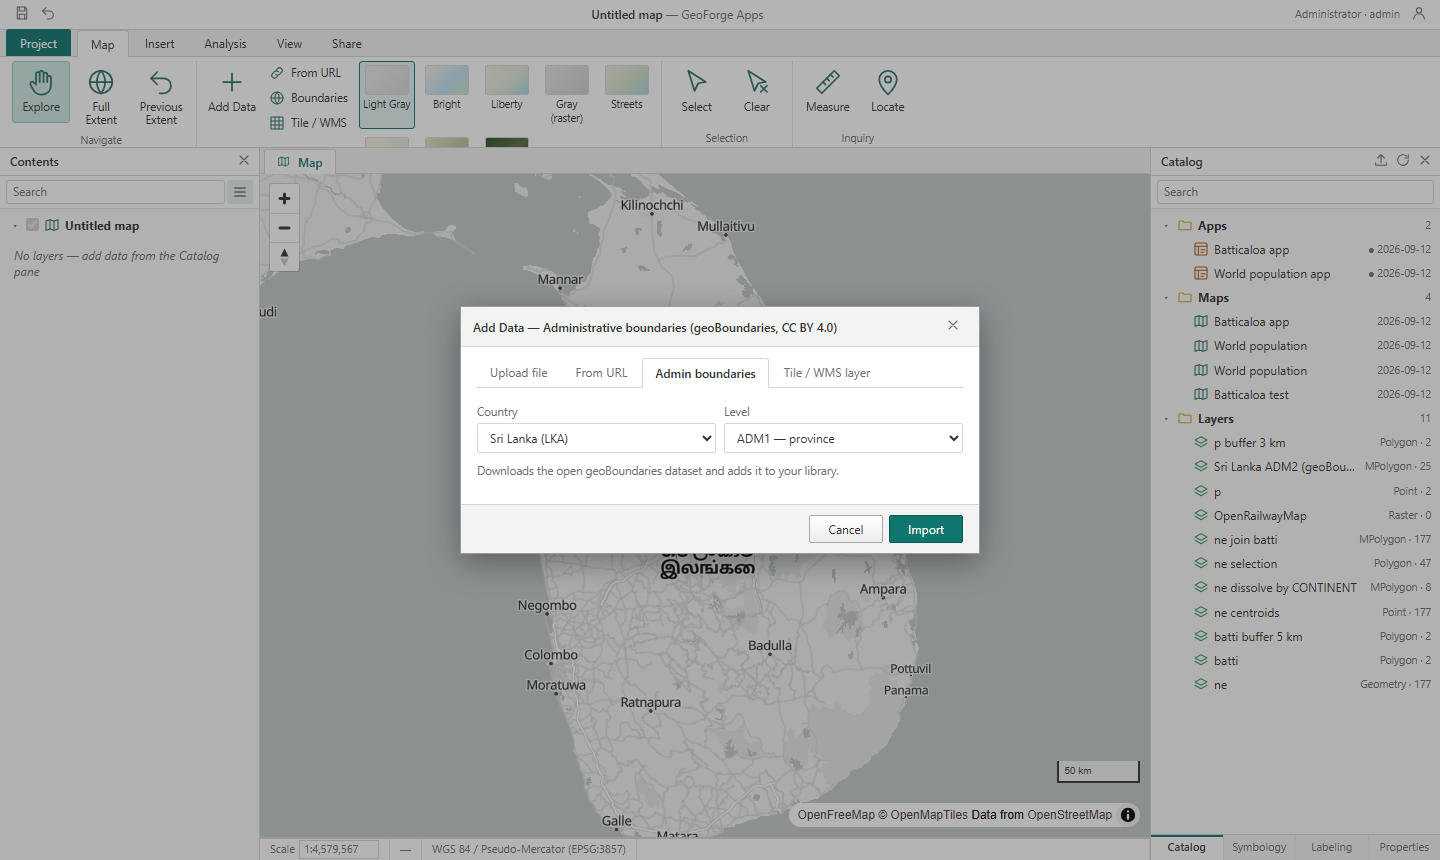
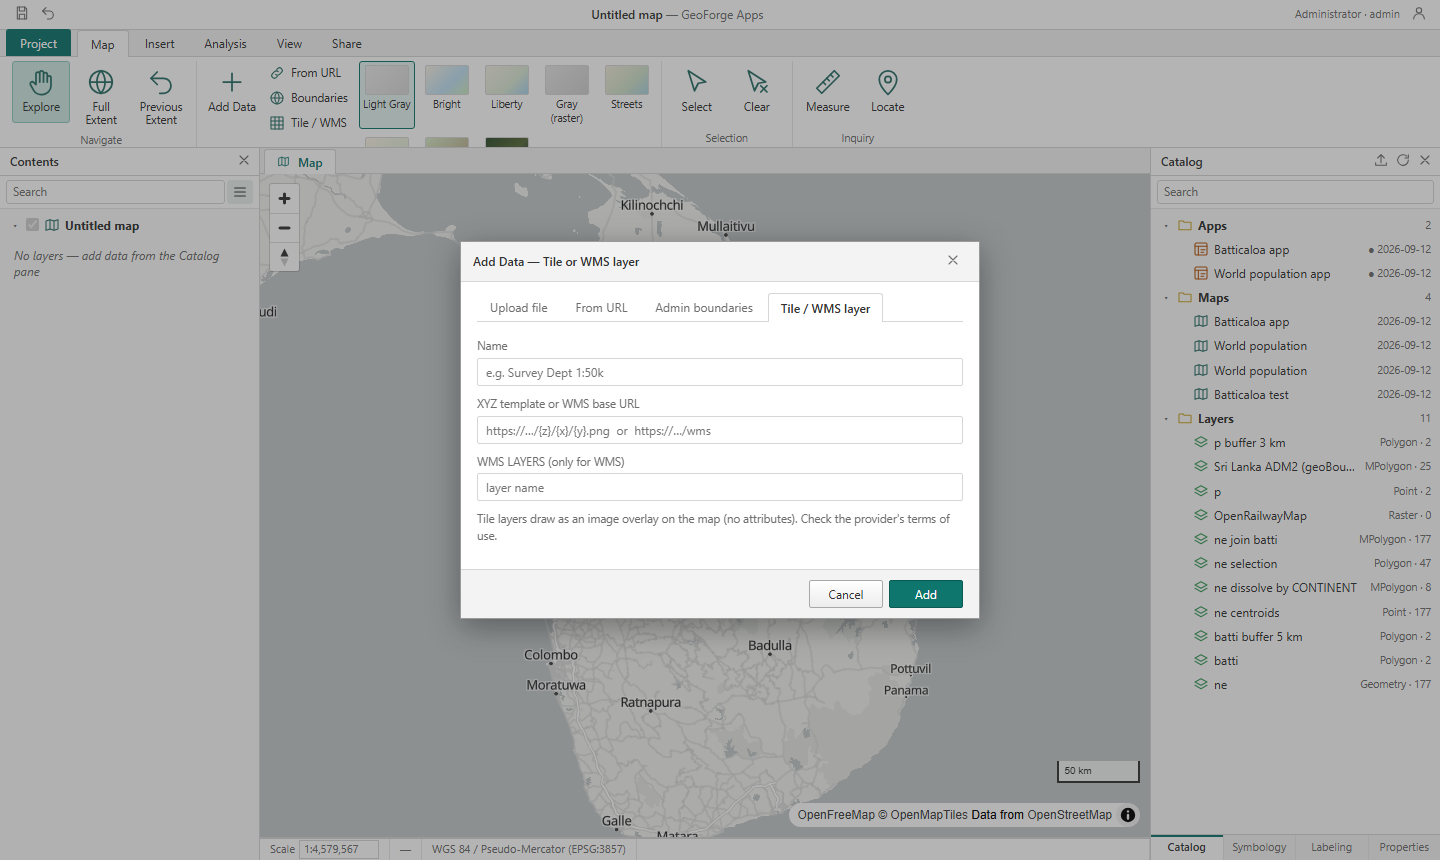
FeatureServer layers.Spreadsheets with coordinates
A CSV or Excel file becomes a point layer if it has columns named like lat/lon, latitude/longitude, y/x or northing/easting. Values must be decimal degrees (e.g. 7.7102, not 7°42').
Coordinate systems — the one thing that goes wrong
.prj, so the software could not tell what coordinate system it uses. GeoTee asks you when this happens. Most Sri Lankan Survey Department and district data is in SLD99 (EPSG:5235); older files use Kandawala (EPSG:5234). GPS and most web data is WGS84.Once imported, every layer is stored in WGS84 and reprojection is automatic — you never need to think about it again. Right-click a layer in the Catalog and choose Properties to see the original system, the feature count and the fields.
name, lat, lon (for example your office at 7.7102, 81.6924) and upload it. (c) Add both to the map.3Working with the map
| Task | How |
|---|---|
| Change the basemap | Map tab → gallery. Light Gray is best under coloured data; Imagery is Sentinel-2 satellite. |
| Identify a feature | Click it in Explore mode — a pop-up shows its attributes. |
| Select features | Map › Select, click a feature (Shift-click to add more). Clear removes the selection. |
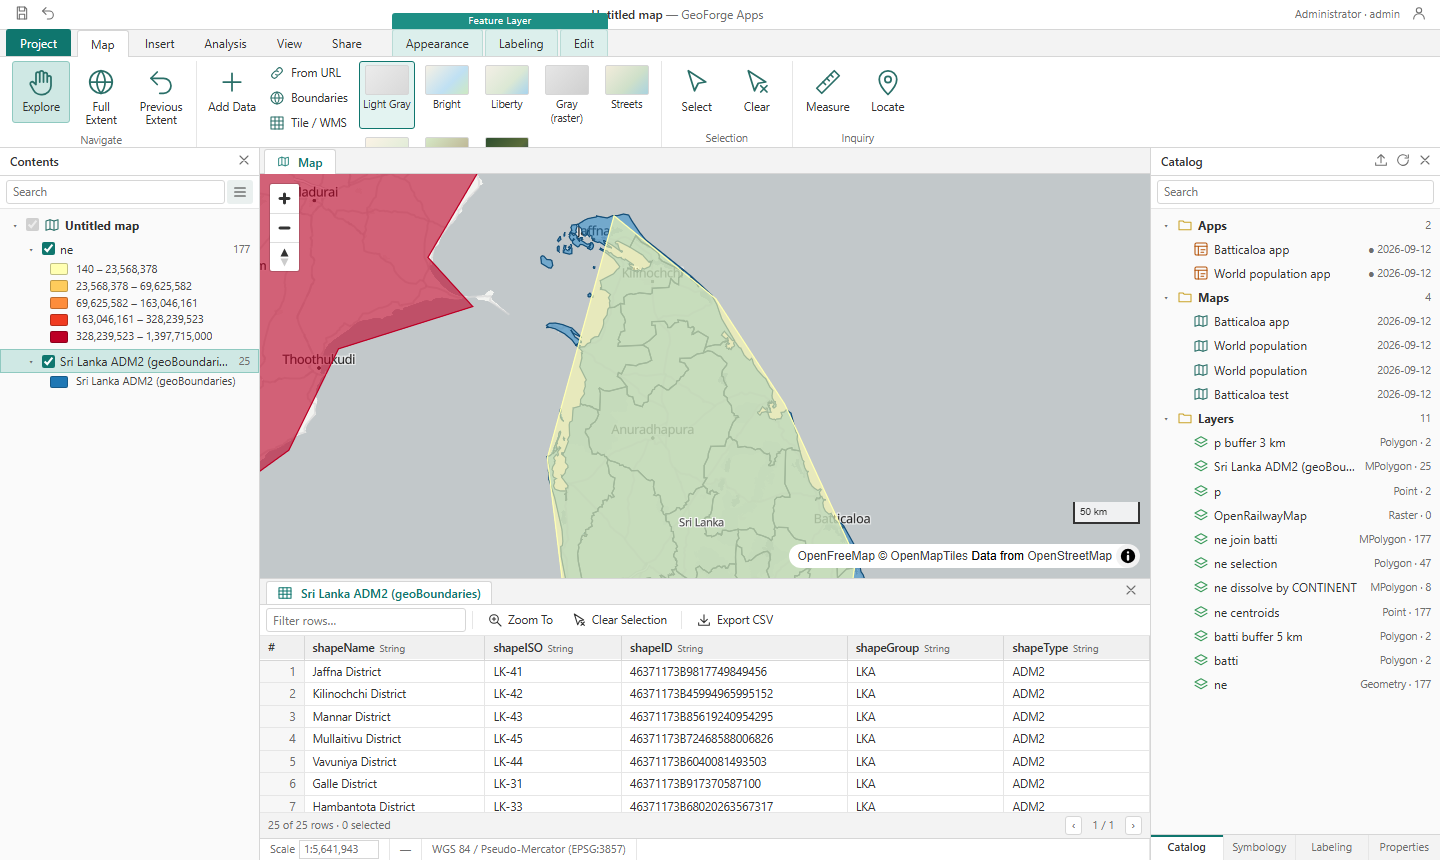
| See all attributes | Select the layer, then Feature Layer › Attribute Table (or double-click the layer in Contents). Filter rows, click a row to highlight it on the map, double-click to zoom to it, Export CSV to download. |
| Measure | Map › Measure, click points, double-click to finish. The length shows in the status bar. |
| Zoom to a layer | Right-click the layer in Contents → Zoom To Layer. |
| Save the map | Ctrl+S or Share › Save Map. Saved maps are listed in the Catalog under Maps. |
| Export a picture | Share › Export Map PNG — includes a title, legend, scale bar and attribution. |
4Symbology and labels
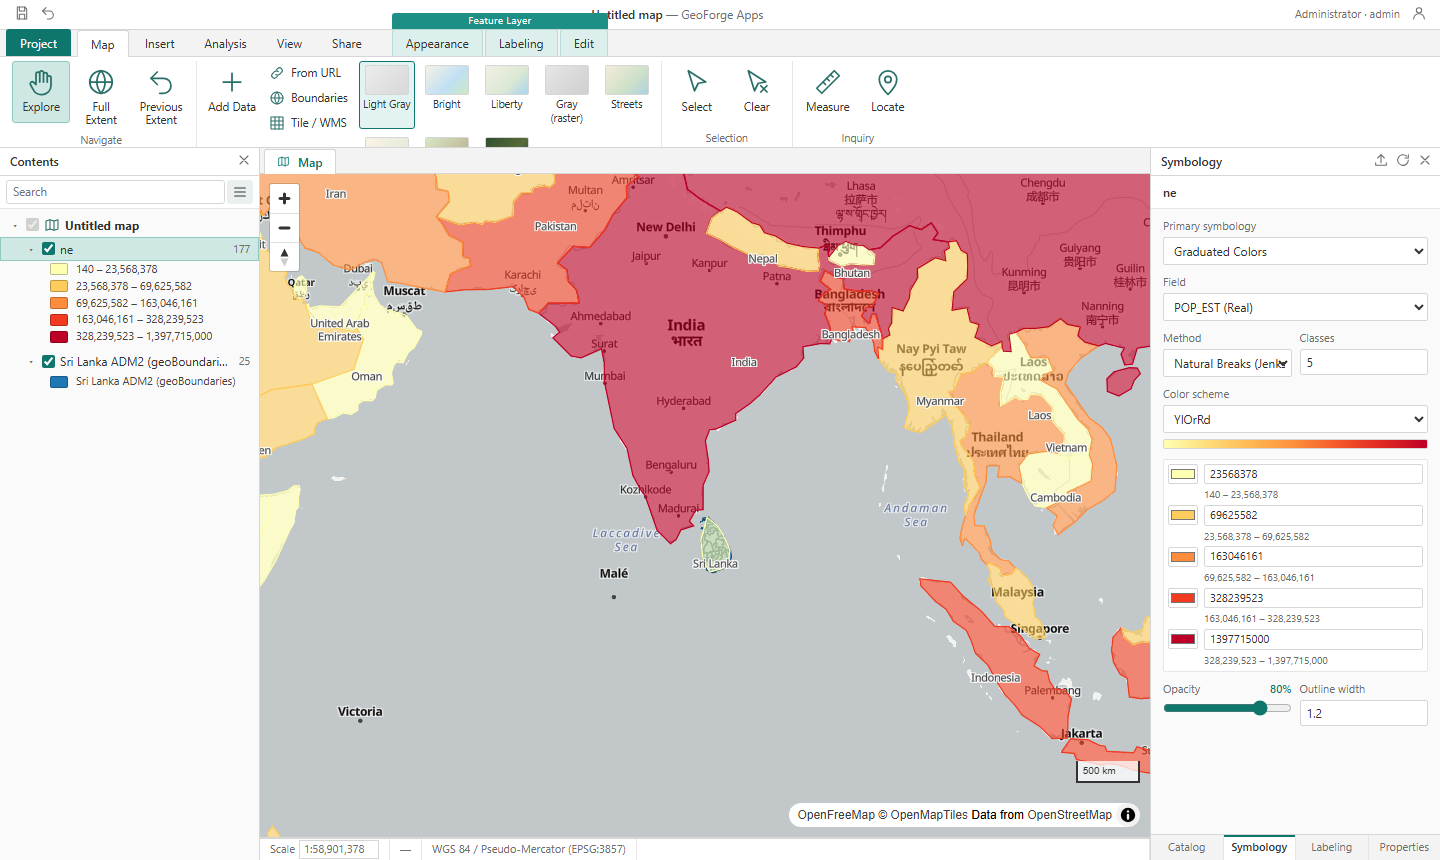
Select a layer in Contents, then open the Symbology pane (bottom tab of the right pane, or Feature Layer › Appearance › Symbology). Changes apply immediately to the map and to the legend in Contents.
| Primary symbology | Use it for |
|---|---|
| Single Symbol | One colour for everything. Set fill colour, outline, opacity, point size. |
| Unique Values | A colour per category (district name, land-use class, status…). Shuffle colors re-assigns the palette; each value's colour and label can be edited. |
| Graduated Colors | A numeric field shown in classes (choropleth). Methods: Natural Breaks (Jenks) for most data, Equal Interval when the range matters, Quantile for equal counts. |
| Graduated Symbols | Point size by a numeric field (e.g. population of towns). |
| Heat Map | Density of many points (incidents, households). |
Labels
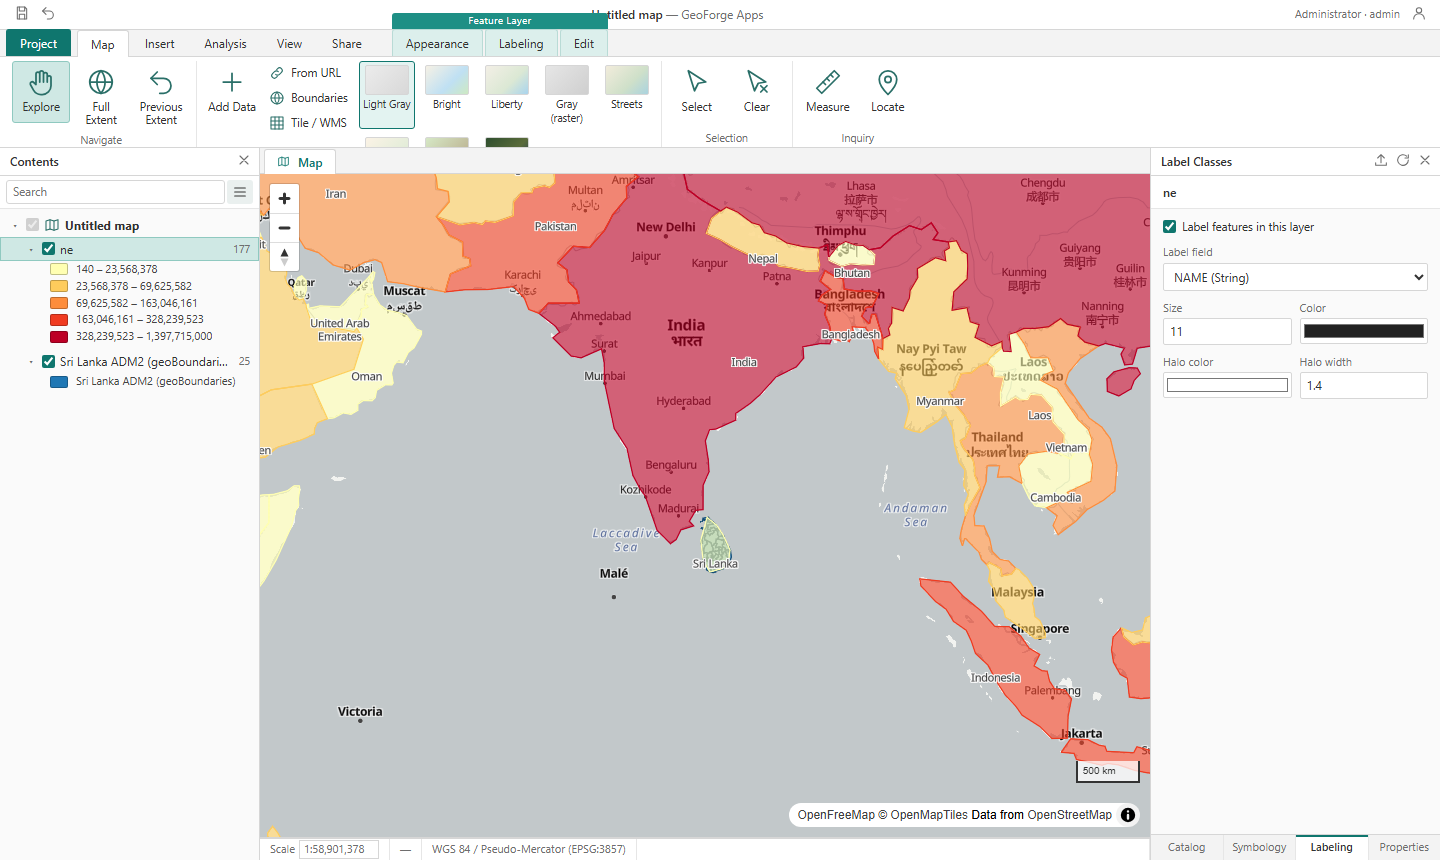
shapeName, then switch to Single Symbol with a 30 % opacity fill and label them with shapeName at size 11.5Analysis tools
The Analysis tab runs geoprocessing on the server. Every tool produces a new layer in the library; your input layers are never changed. Select the input layer in Contents first, then click a tool.

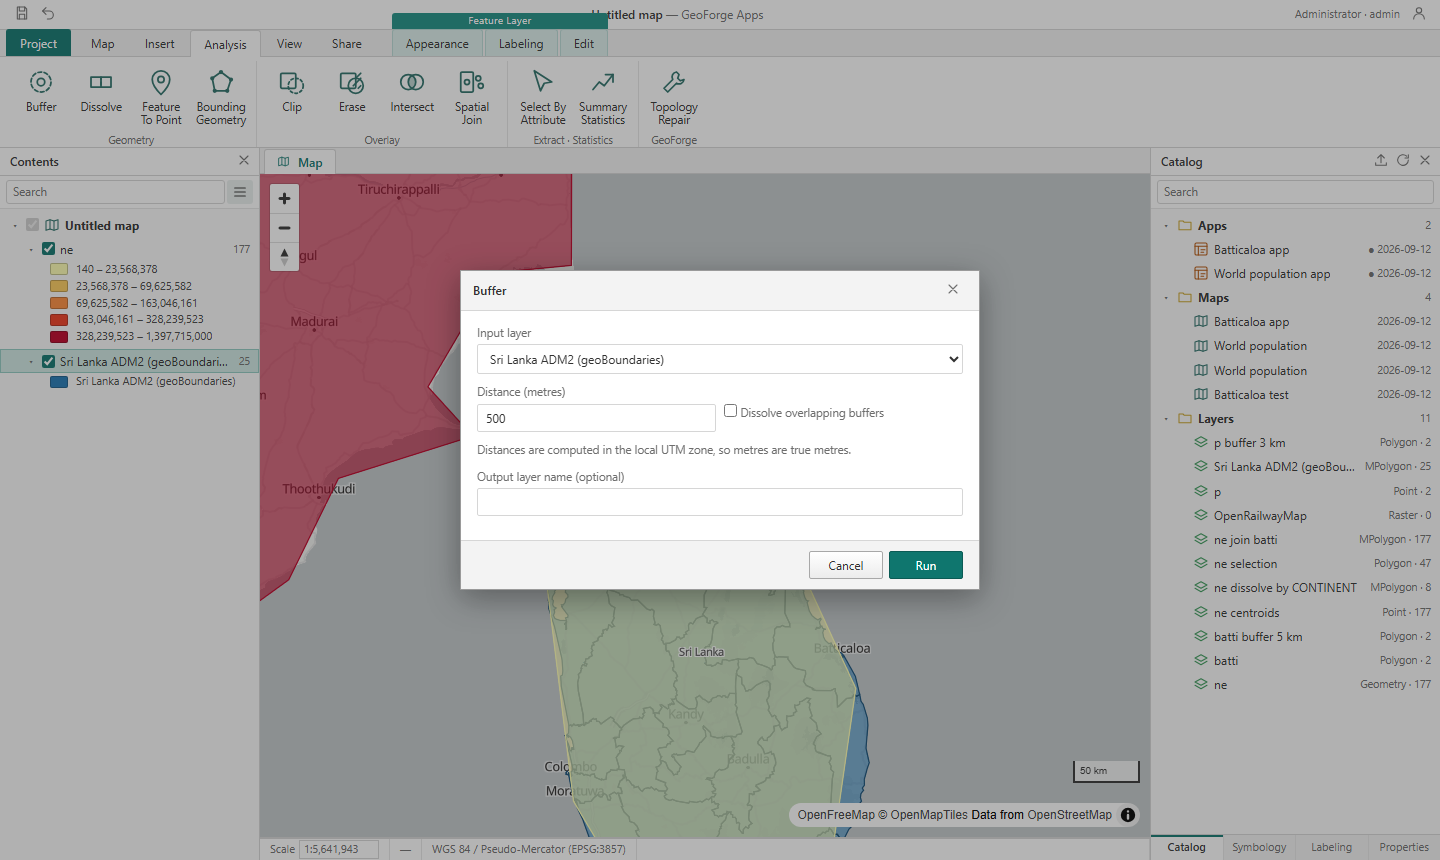
| Tool | What it answers | Example |
|---|---|---|
| Buffer | What is within X metres of these features? | 500 m around schools; 2 km around a river |
| Dissolve | Merge features that share a value (with counts and sums) | GN divisions → DS divisions, summing population |
| Feature To Point | One point inside every polygon | Label points, distance calculations |
| Bounding Geometry | The outline around all features | Project area from survey points |
| Clip | Keep only what falls inside another layer | Roads inside one district |
| Erase | Remove what falls inside another layer | Land minus protected areas |
| Intersect | Overlaps with attributes from both layers | Flood zone × GN division |
| Spatial Join | Count (or sum a field) of layer B inside each feature of layer A | Households per GN division; wells per district |
| Select By Attribute | A new layer of features matching a condition and/or location | Districts where POP > 500000; villages inside a buffer |
| Summary Statistics | Min / max / mean / sum of a field, total area and length | Total road length in km |
join_count column.6Editing data
Select a vector layer, open Feature Layer › Edit and press Start Editing. Everything you do is kept as unsaved edits until you press Save Edits; Discard throws them away.
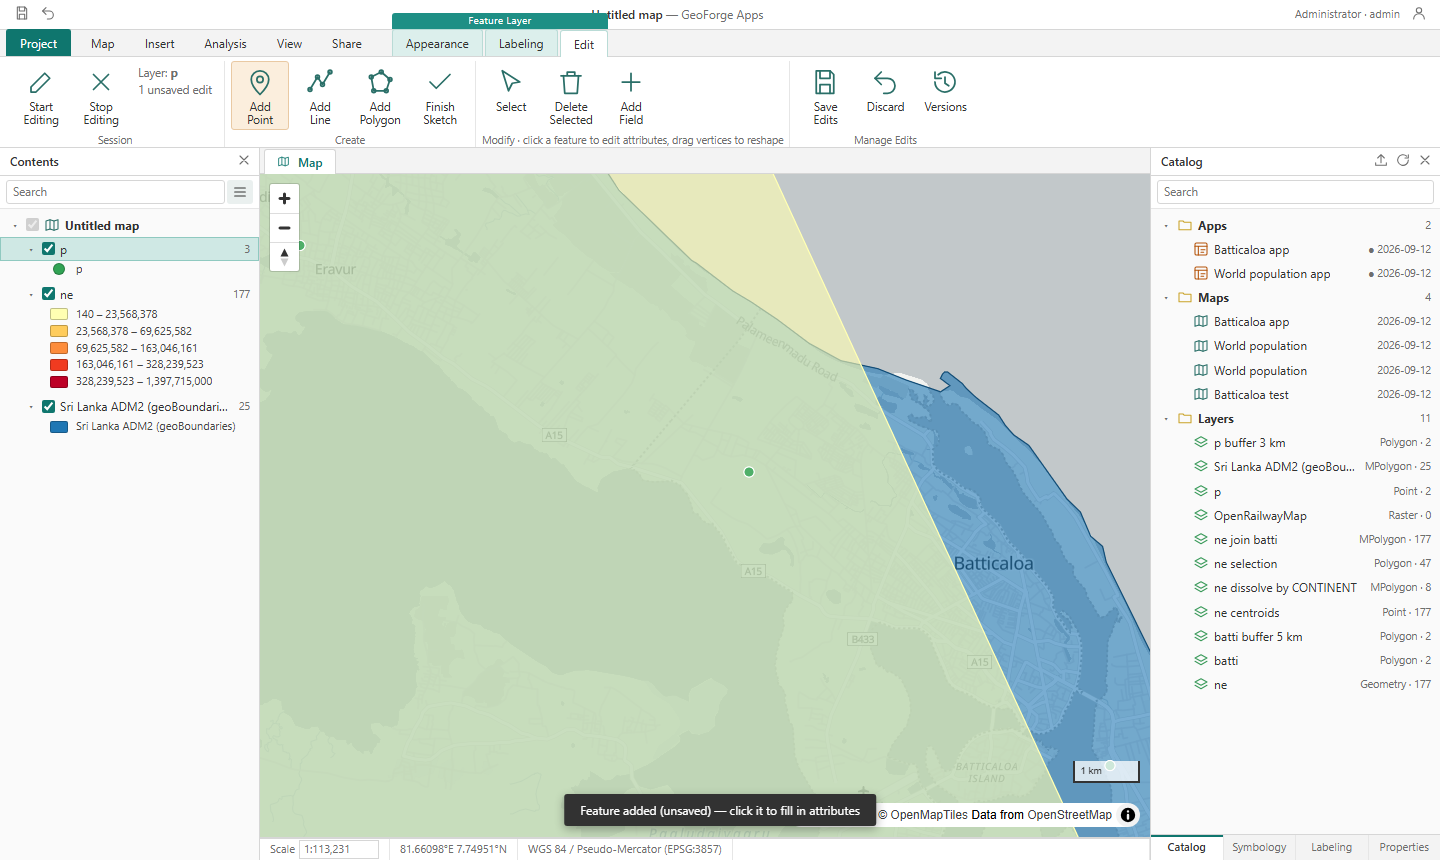
- Edit attributes — click a feature on the map; a form opens with every field. Change values and press Apply. In the attribute table you can also double-click a cell.
- Add features — Add Point then click the map; Add Line / Add Polygon then click each vertex and double-click to finish (or press Finish Sketch). New features start with empty attributes — click them to fill in.
- Reshape — click a feature; its vertices appear as handles. Drag a handle to move it.
- Delete — select features (Select tool or table rows) and press Delete Selected, or use Delete feature in the edit form.
- Add Field — adds a new empty column to every feature.
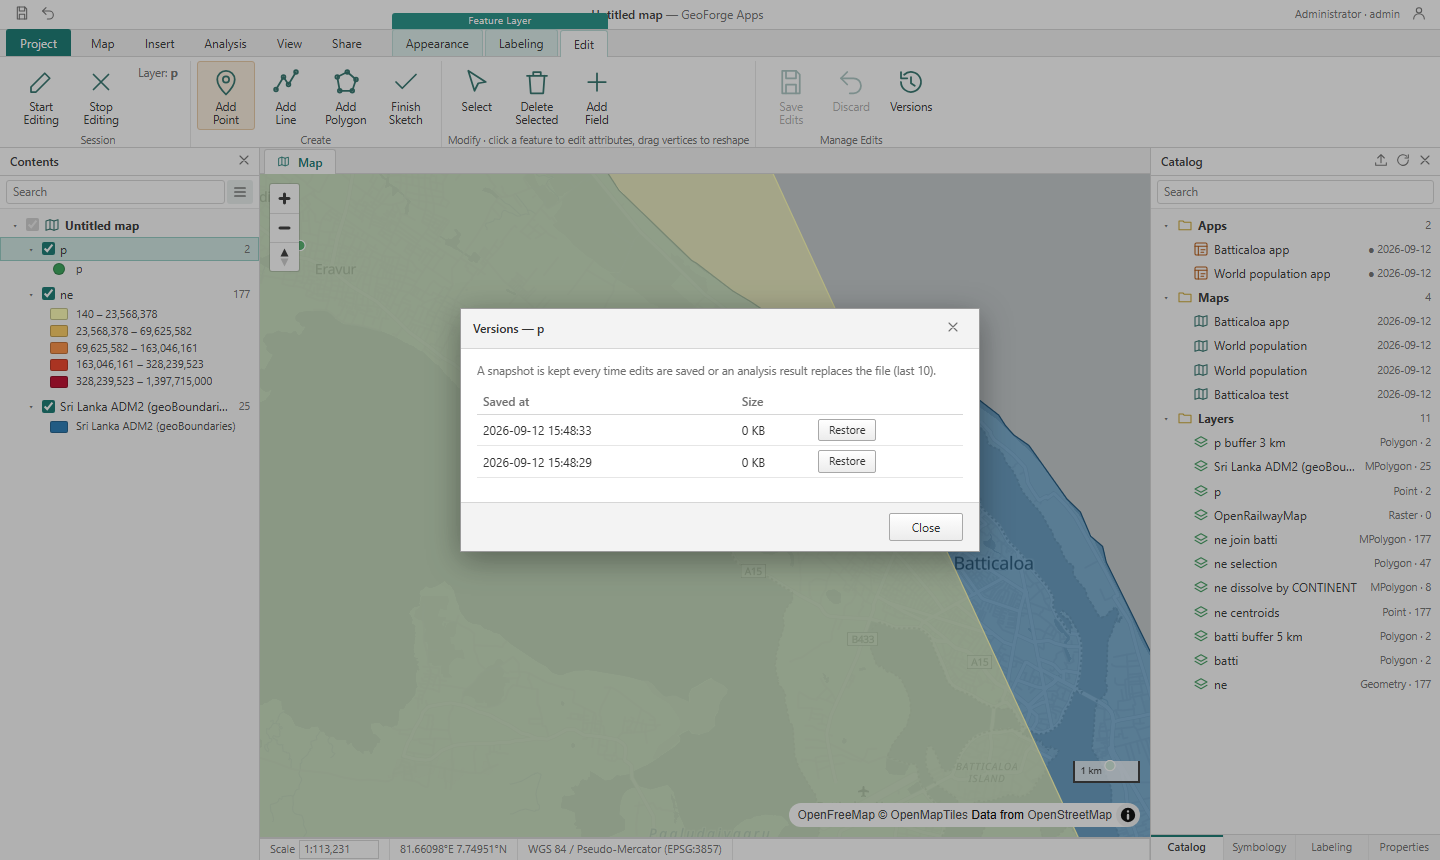
- Save Edits — writes the changes to the library. A snapshot of the previous state is kept automatically.
7Building an app
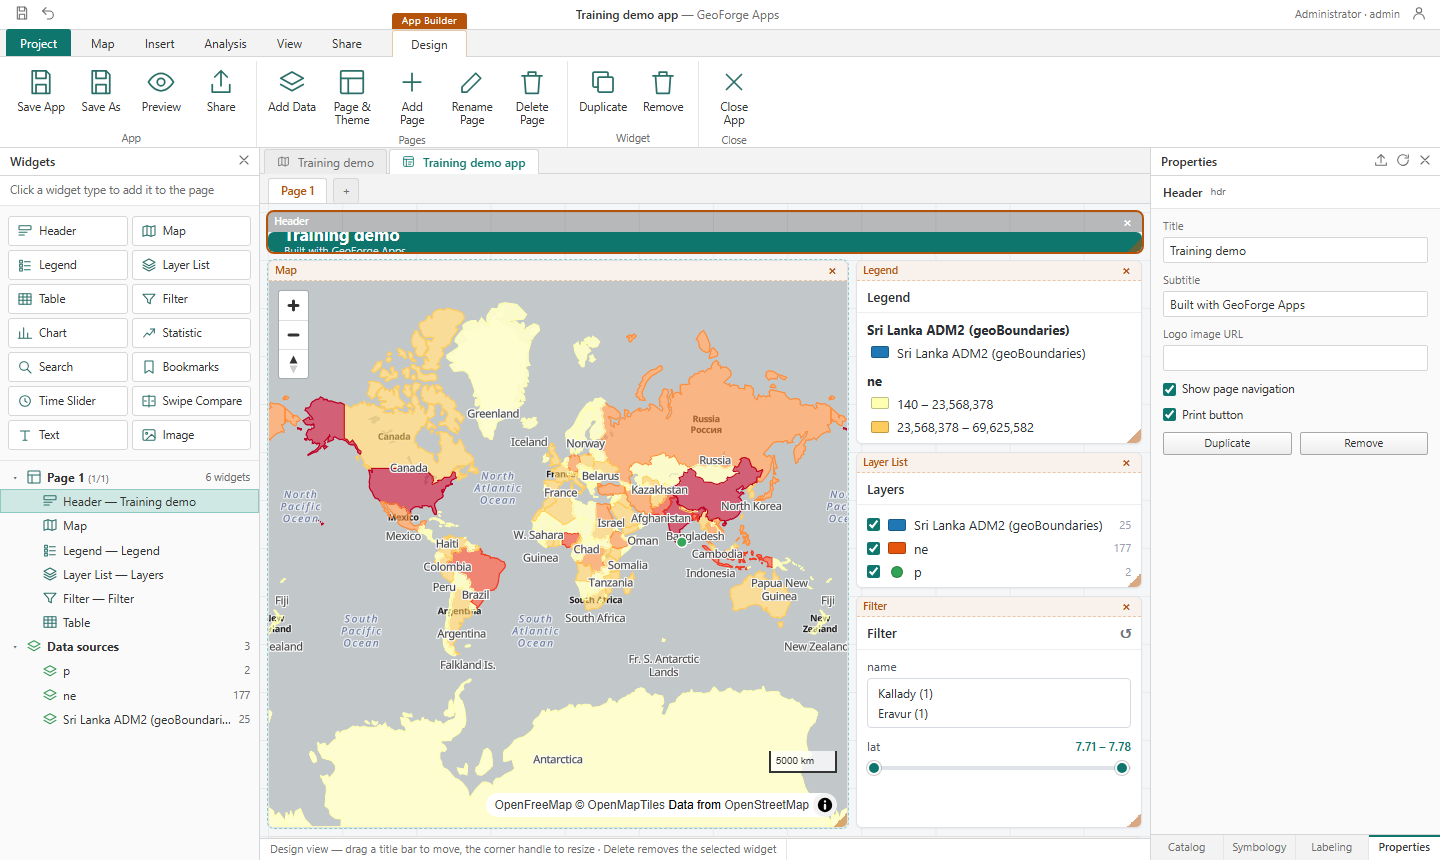
An app is a web page made of widgets — map, legend, filter, chart, table and so on — that talk to each other. Build the map first (layers, symbology, labels), then Insert › New App from Map.
Arranging widgets
- Click a widget type in the palette to add it. Drag its title bar to move it; drag the corner handle to resize. The page is a 12-column grid.
- Click a widget and edit its settings in Properties. Delete removes the selected widget.
- Data widgets (Table, Filter, Chart, Statistic, Search, Time Slider) point at a data source — one of the layers in the app. Add more layers from the Catalog by double-clicking them.
- The Map widget's Update layers & symbology from Map view button copies whatever you have styled in the Map view into the app.
| Widget | Does |
|---|---|
| Header | Title, subtitle, logo, page navigation, optional Print button |
| Map | The map with its layers and basemap; pop-ups on click |
| Legend / Layer List | Explain the map; let viewers turn layers on and off |
| Filter | Drop-downs and range sliders on fields — the map, table, chart and statistic all follow |
| Chart | Bar or pie by a field, count or sum. Clicking a bar filters everything else |
| Table / Statistic / Search | Attribute grid · one big number · find a feature by name |
| Time Slider | Play through a date or number field; features appear as the slider advances |
| Swipe Compare | Two synchronised maps with a draggable divider — before/after, plan vs. survey |
| Bookmarks | Named views the visitor can jump to |
| Text / Image | Explanations, photos, logos |
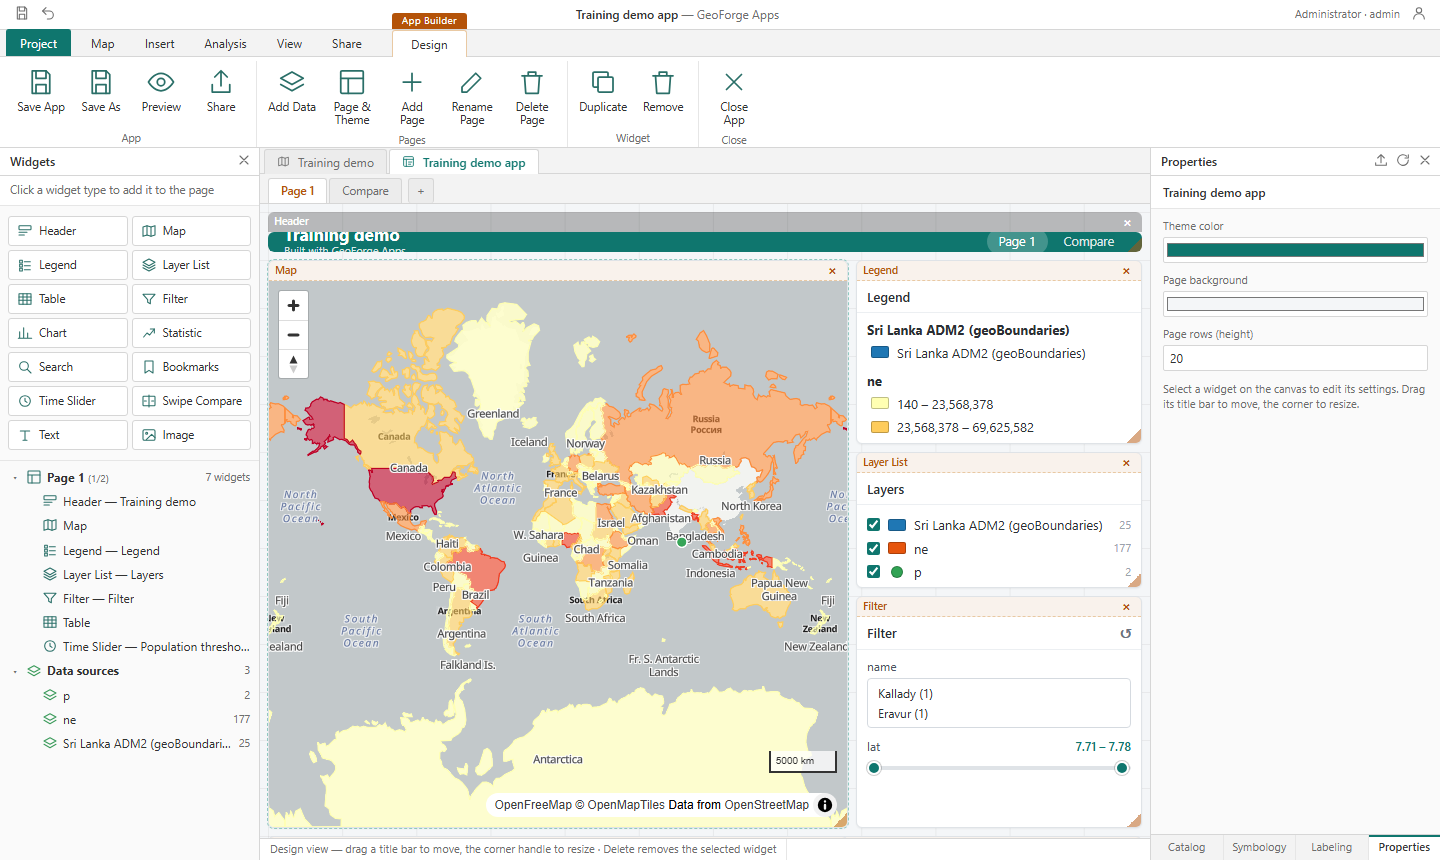
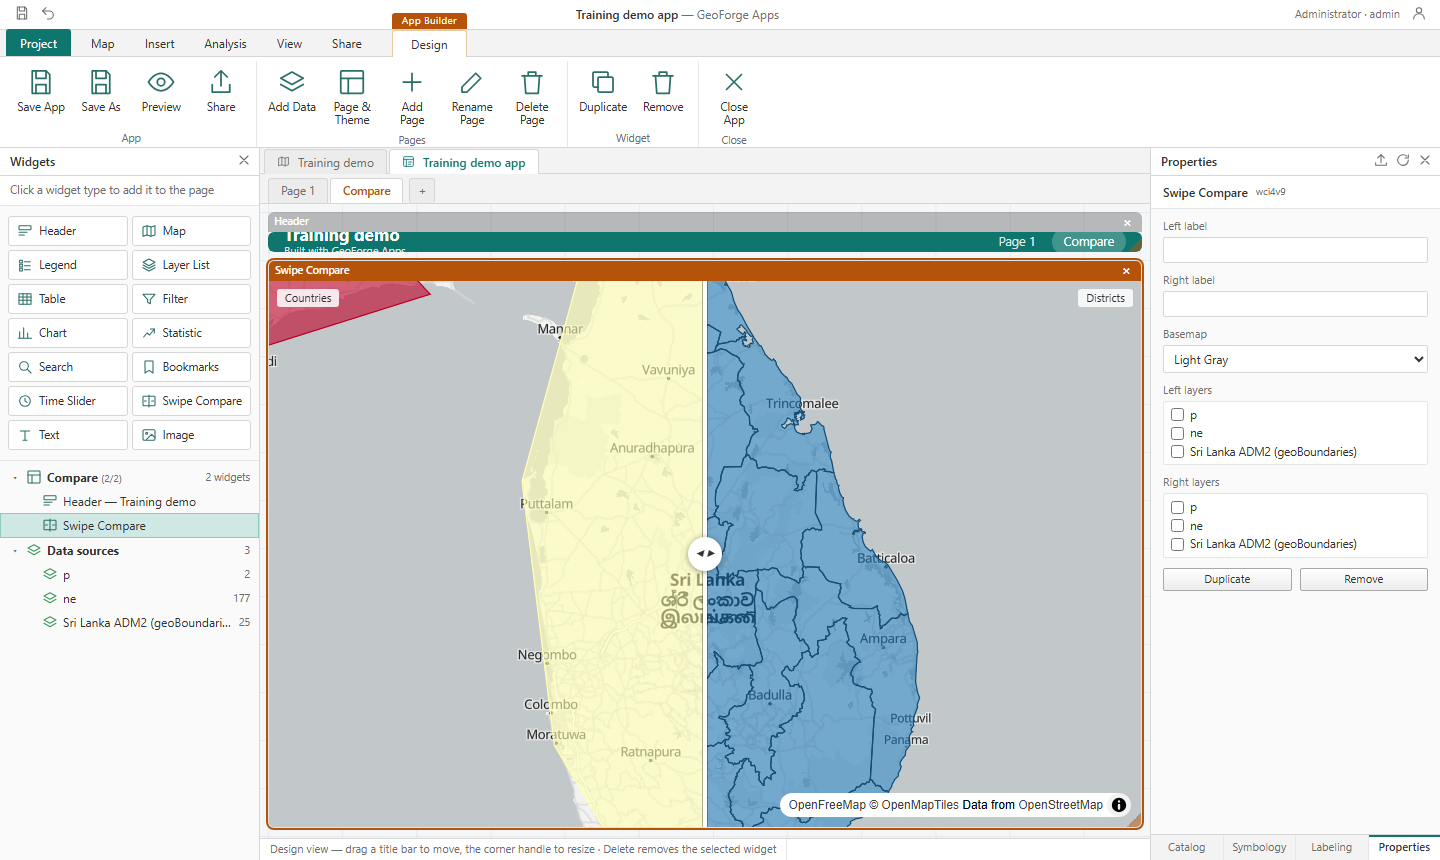
shapeName), a Statistic (count), and a second page with a Swipe Compare of districts vs. your buffer layer. Preview it.8Sharing and publishing
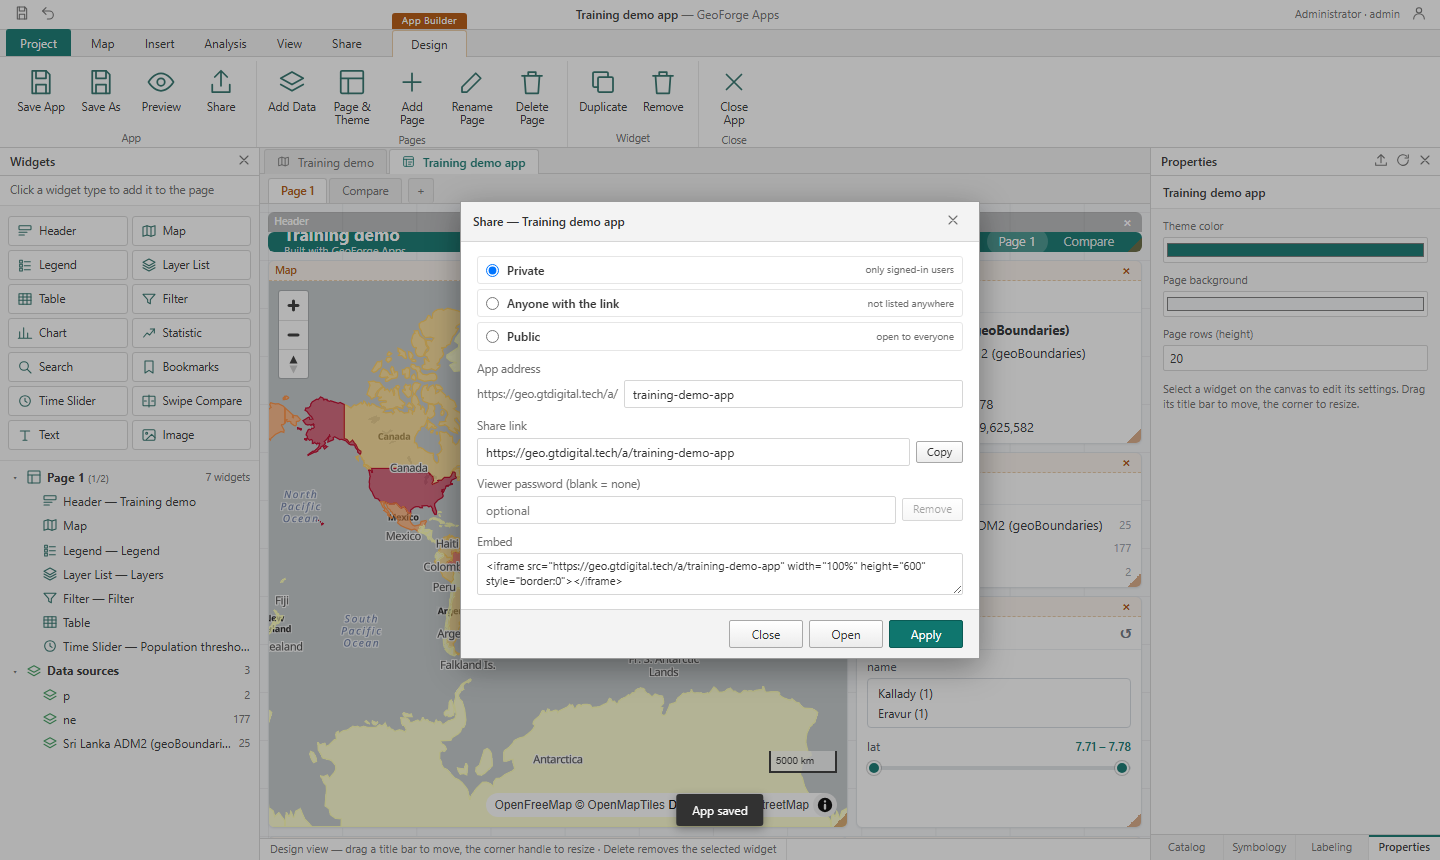
| Setting | Meaning |
|---|---|
| Private | Only signed-in users of GeoTee can open it. |
| Anyone with the link | No sign-in needed, but the app is not listed anywhere. Good for sharing with a committee or a client. |
| Public | Open to everyone. |
| Viewer password | Visitors must type this password before the app opens — for link/public apps that carry sensitive layers. |
| Embed | Paste the <iframe> into any website or WordPress page. |
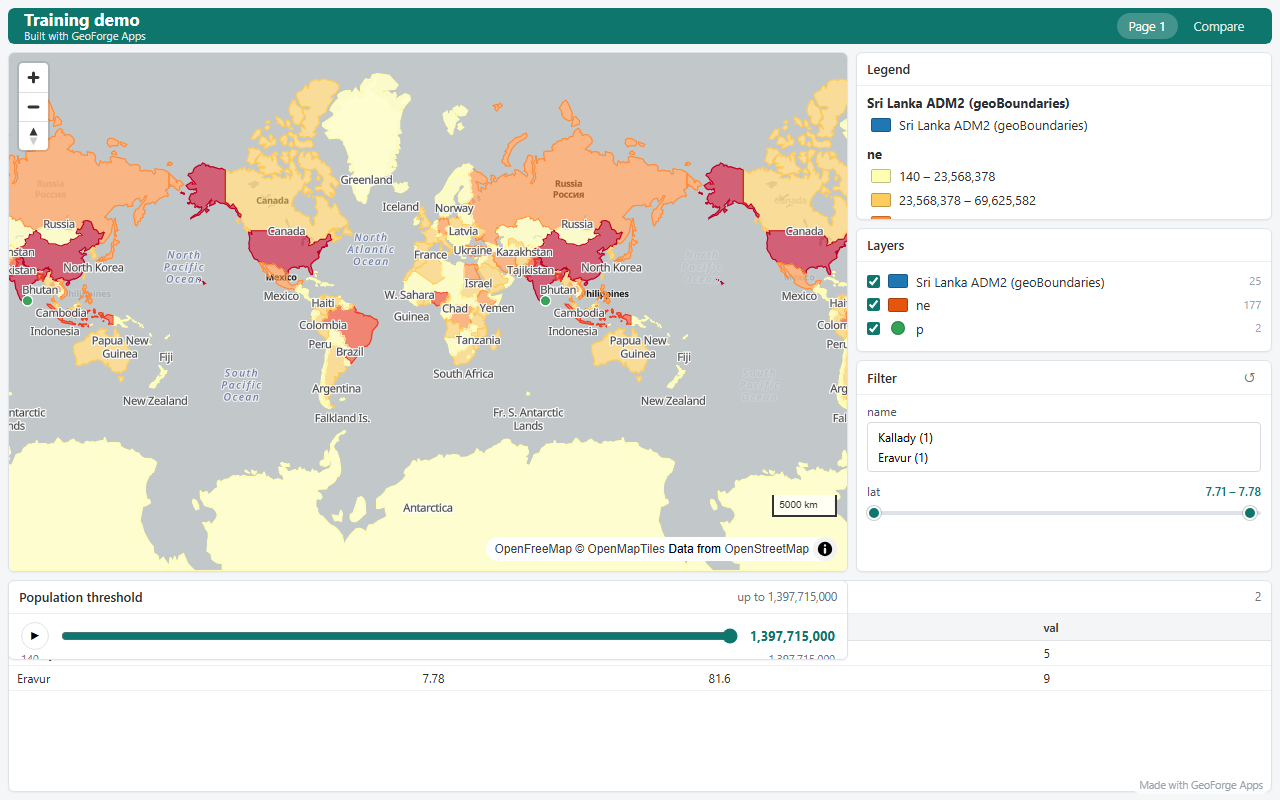
training, open the link in a private browser window and confirm the password prompt appears.9Users and administration
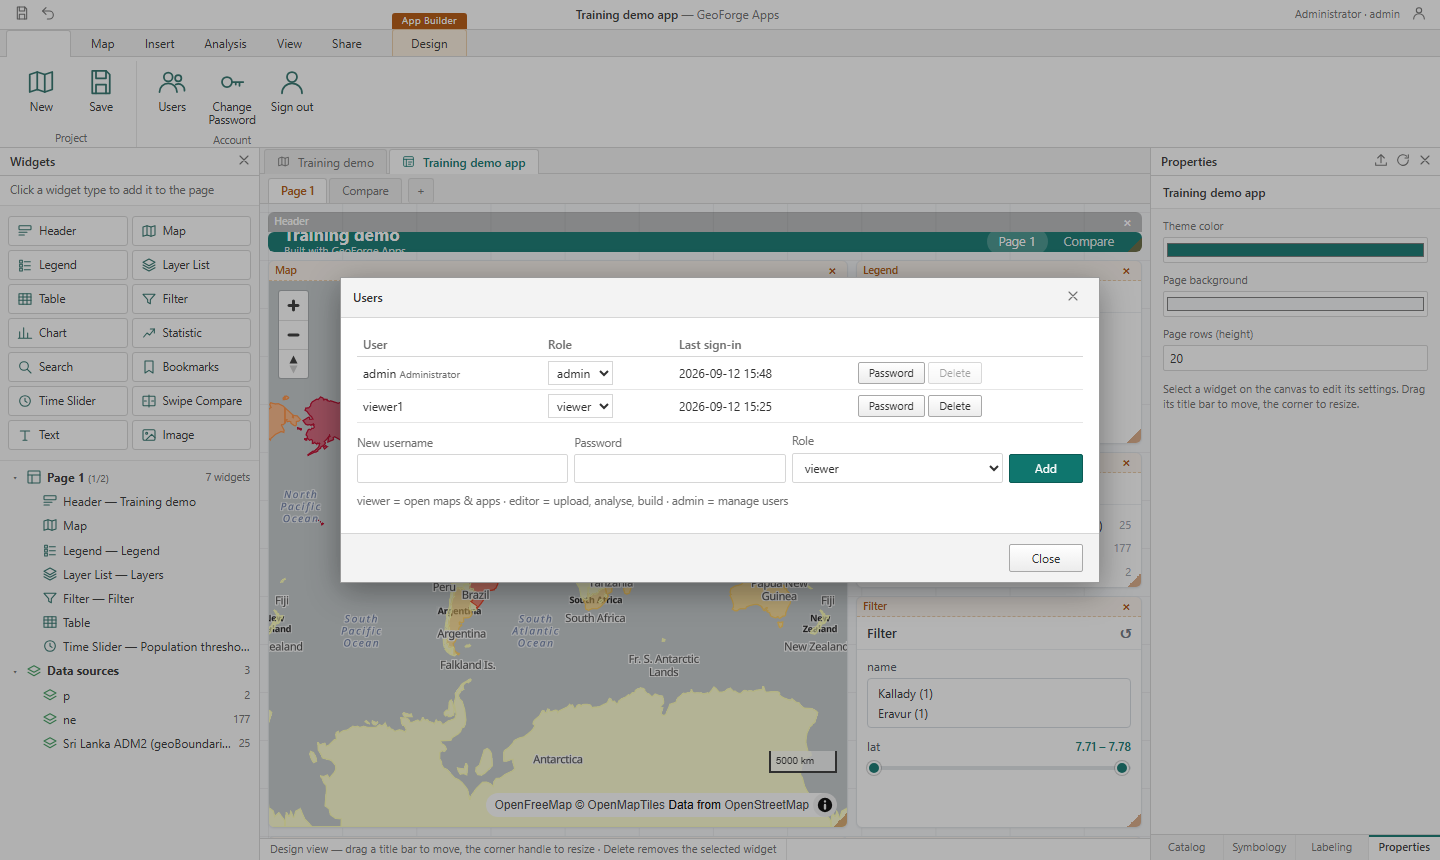
- Give most people the viewer role. Make someone an editor only if they upload, analyse or build. Keep admin to one or two people.
- Everyone can change their own password under Project › Change Password. Change the default admin password on day one.
- The Catalog shows a dot (●) next to apps that are published, and each app counts its views.
- Deleting a layer from the library removes it from every map and app that used it — the Catalog warns you. Prefer renaming or leaving it in place.
≡Reference and glossary
Keyboard
| Ctrl+S | Save the map or app | Esc | Close a dialog, cancel a sketch or measurement |
| Delete | Remove the selected widget (App Builder) | Shift+click | Add to the selection |
Supported formats
Shapefile (zipped) · GeoJSON · KML / KMZ · GeoPackage · GPX · CSV / XLSX with coordinates · FlatGeobuf · XYZ tile services · WMS · ArcGIS REST FeatureServer layers.
Glossary
| Layer | One dataset — a set of points, lines or polygons with a table of attributes. |
| Feature | One row of a layer: a single district, road or well, with its shape and attributes. |
| Attribute / field | A column in the layer's table (name, population, status…). |
| Coordinate system (CRS) | How coordinates map to the Earth. WGS84 = latitude/longitude used by GPS and the web. SLD99 / Kandawala = Sri Lanka's national grids in metres. |
| Basemap | The background map (streets, light gray, satellite). |
| Choropleth | Areas coloured by a value in classes — what Graduated Colors makes. |
| Widget | One building block of an app (map, legend, chart…). |
| Data source | A layer as seen by the widgets of an app; filters and selections on it are shared by all widgets. |
✓Completion checklist
A trainee has completed the course when they can do all of the following without help:
- Sign in, describe the four areas of the workspace and switch basemaps
- Upload a zipped shapefile and a CSV, and explain what to do when the CRS prompt appears
- Open the attribute table, filter it, select a row and export CSV
- Apply Unique Values and Graduated Colors symbology and add labels
- Run Buffer and Spatial Join and interpret the result layer
- Add a feature, edit its attributes, save, and restore a version
- Build an app with map, legend, filter, chart and table on two pages
- Publish with a link and a password and open it from another device